Analytics 📈
Under navigation item Analytics you find numbers LoyJoy collects about your agents to see how your customers are using your agents and how they are performing. The numbers can be visualized in different ways. You can export the variables as CSV, but it is not possible to download the Analytics as a whole.
You can also sign up for a weekly report by email on the performance of each agent.
LoyJoy collects anonymized and aggregated data, so you can not identify any individual customer and itself does not track customer website behavior. Learn more about our Data Security and Privacy in the Data Security section.
You can integration with tracking solutions such as Google Analytics, Google Tag Manager or a custom solution provided by you. How to integrate these solutions is described in the Tracking Integration section.
Dashboard tab
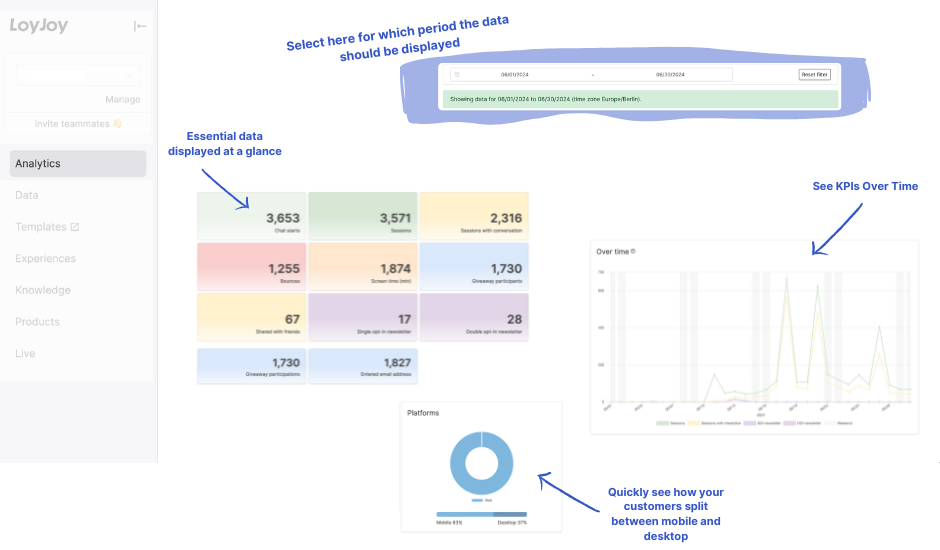
Once you are in the Analytics tab, the first tile you see is the Dashboard where can find your aggregated, tenant-wide KPIs, means the KPIs of all your agents. You can filter the data by date and agent. The dashboard gives you a quick overview of the most important KPIs of all your agents.
Overviews tab
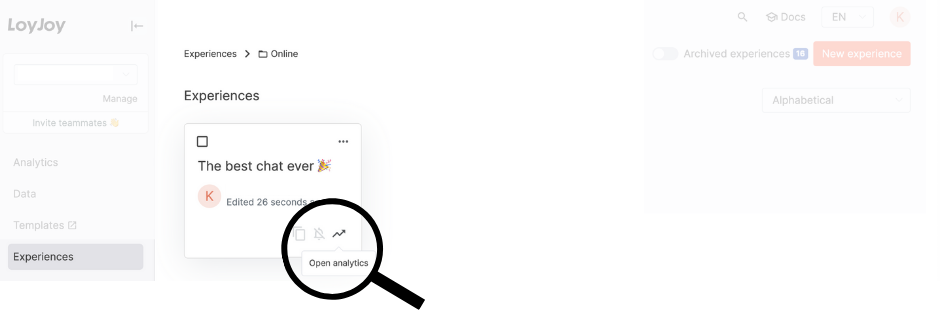
Each agent has its own Overview. You can find it in the Analytics tab under the respective agent, or by clicking on the chart icon in the agent.
Drill Down tab
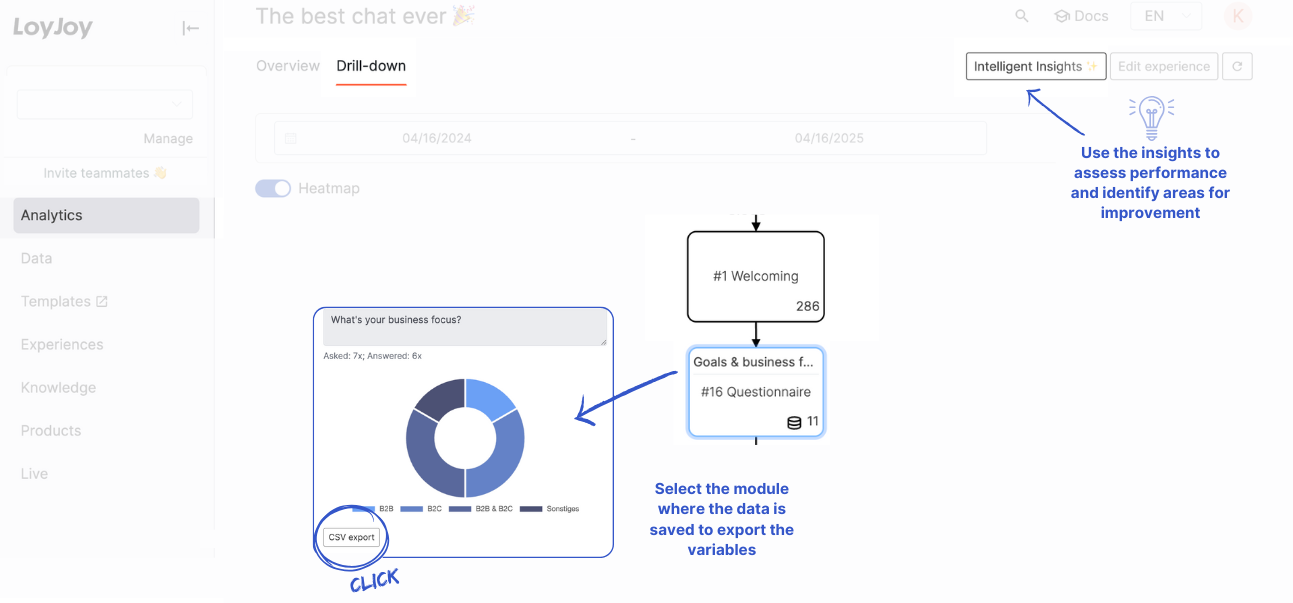
In the Drill Down tab you can find the heatmap depicting which BPMN process modules were visited how often and allows you to click on each module to analyze module-specific data.
General Information
Visualization
The data is visualized in the Dashboard and each Overview. You can also filter the data by date range.
Intelligent Insights
In the Dashboard and Overview tabs, you can find the Intelligent Insights section. This section provides you with the Analysis of dropout rates and suggestions for improvement by KI.
Export
It is currently not possible to export Analytics data. In Analytics, an export is nevertheless offered in some modules of the Drilldown tab - why? This option is only displayed in modules with saved variables (Make sure that the variables are saved when you build agent and before you collect them). The “CSV export” button does not export the displayed Analytics data (although we are in the view), but only the variables of the module. If you export them, you can create your own graph with the data.
Report
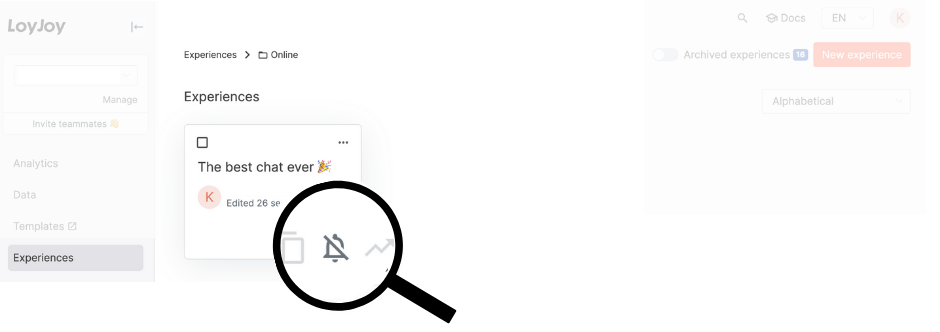
If you click on the bell icon, you can sign up (or unsubscribe) for a weekly report by email on the performance of each agent.
Detailed Description of the KPIs
Not all figures are always displayed. For many, a special module is required to generate the number. For example, the “Share” module to send the link to friends and then track this number, or the “NPS” module to calculate the score.
Essential KPIs
| KPI | Description |
|---|---|
| Chat Starts | Number of chat starts within this process. Once the Chat is opened in the browser, a chat start will count, no user interaction is required. If customers restart the agent, this will also count as a chat start. Unlike sessions, this does not apply across agents. Note: The Session-Reset-Module can cause problems so that a chat start may be counted twice. |
| Sessions | Number of chat sessions started. Only one message from the chat is required to start a session, no user interaction is required. This applies across all processes. Within 30 minutes it still counts as one session if the customer skips between agents within the chatbot. |
| Sessions With Conversation | A session with conversation is counted as soon as the customer interacts (clicking a button, typing a message). Within 30 minutes it still counts as one session if the customer skips between other agents within the chatbot. |
| Bounces | A bounce is counted when the customer has neither typed anything in the chat nor clicked on a button before closing the chatbot or website again. |
| Screen Time (Min) | Total screen time spent by all customers within this agent in minutes. |
All KPIs in absolut numbers
| KPI | Description | Module |
|---|---|---|
| Average handling time | ||
| Asked for Web Push | Number of customers who were asked for a web push opt-in. | |
| Conversations | Total number of conversations within this agent. A conversation starts when there is an interaction from the customer, such as clicking on a button or typing something into the chat. | |
| Live Chats | Number of live chats started. A live chat is counted as soon as the customer clicks on the button to start a live chat. | |
| Double Opt-in/DOI Web Push | Number of customers who have given their consent to a web push double opt-in. | |
| Giveaway participation | ||
| New Customers | Number of customers who have entered their mail address in the email module. | |
| Participations | Total number of participations through the participation module. The participation module is mostly used for raffles. If multiple participations are allowed, the individual participants are counted multiple times (no unique users) | |
| Pin Email Sent | Number of pin emails sent. | |
| Pin Succeded | Number of pins successfully entered. | |
| Pin Failed | Number of pins entered incorrectly. | |
| Products clicked | ||
| Products shown | ||
| Shared via Facebook, email, native, X, WhatsApp | Number of customers who clicked on the Facebook/email/native/X/WhatsApp option within the share link module. | Share link |
| Single Opt-in/SOI Web Push | Number of customers who have given their consent to a web push single opt-in. | |
| Total handling time |
Numbers of the NPS module
| KPI | Description |
|---|---|
| Net Promoter Score | Result of the Net Promoter Score survey in the NPS module. The Net Promoter Score is calculated by asking your customers to provide their feedback on a scale of 0 to 10. To calculate the score, the percentage of Detractors is subtracted from the percentage of Promoters. The difference results in the Net Promoter Score, which can range between -100 and 100. The higher above 0, the more customer-focused your company. A number above 30 is remarkable. 50 is excellent and above 70 is exceptional. |
| Detractors | Customers who rate the NPS with a score between 0 and 6 are referred to as "Detractors". |
| Passives | Customers who rate the NPS with a score between 7 and 8 are referred to as "Passives". |
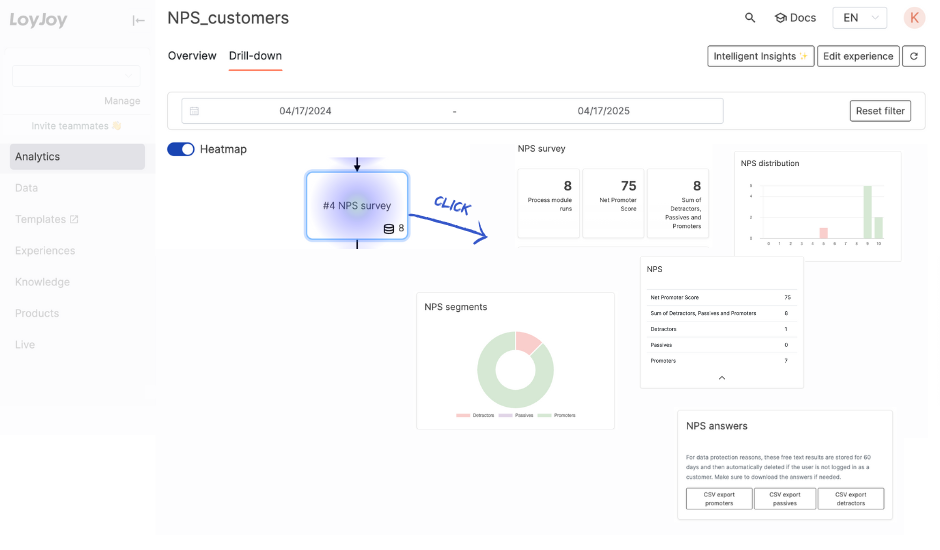
| NPS Segments | This diagram shows the distribution of detractors, passives and promoters. If you hover over it, you will also see the absolute number. |
| NPS Distribution | In this chart you can see the NPS scores per score. |
| NPS Answers | Download the answers (typed content) of the customers in the NPS rating here. |
You can also find an overview of the NPS numbers on the in the Drilldown tab:
Funnel
Here you can see the individual KPIs in a funnel.
Platforms
Take a look at the diagram to see how your customers are split between mobile and desktop. If you hover over it, you get the absolute number.
Log-in Attemps With Code
This diagram shows how often the log in attempt with code worked and how often it did not. If you hover over it, you will also see the absolute number.